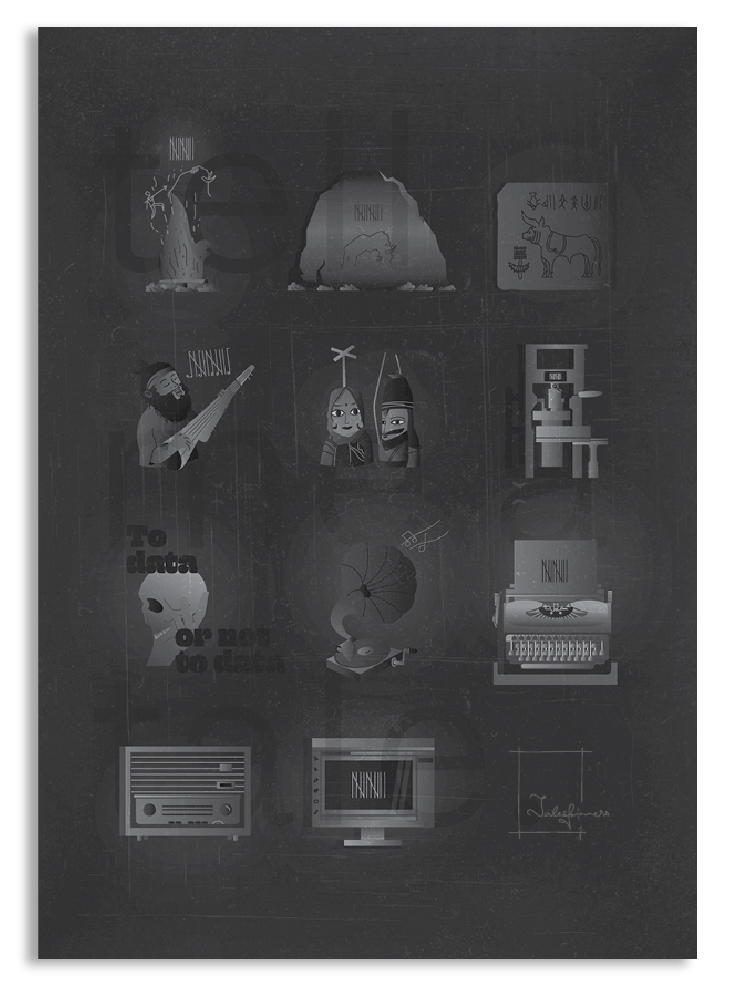
Talespinners unrolled its canvas in 2022. It was founded with the express goal of helping you with your data and design needs. Data is the paint on our analytical palette, our clients and we are the collaborative paintbrush, and the canvas is the limitless possibility of tales.
Talespinners aims to bridge the gap between numbers and design, giving our clients a well-thought-out and cohesive product. We’ll paint our visuals from the stories hidden beneath the large piles of datasets gathered from various sources, dispersed across different documents, or presented in cumbersome reports. We aim to fill our canvas with tales that are not only aesthetic but also cater to your target audience-ranging from policymakers to common folk- since, at the end of the day, they are the ones at the forefront, singing into the winds of social change.
Data visuals are only a static representation of collected information. Visual data storytelling combines data visualization with a rich framework of context and narrative to hook your audience, to engage with your data, to give them food for thought.
A visual data story tells your viewers where the data came from, what it is saying, and most important, why they should care about it. Whether it is your organization’s value to be presented to shareholders, research findings to be placed before governments, or organizational churn which need to be addressed by HR, your data creates value only when it hits home.
“Stories can be found in the rows and columns of spreadsheets.”
Human beings have told stories since the beginning of time. Some are tall tales, some short. Some rhyme, some make you laugh or cry. Some hold hidden meanings, some are told just to pass the time, and others share vital knowledge- whether spoken aloud or conveyed through the many mediums invented over the evolution of storytelling.
Data on its own is just numbers on paper- raw and static. It is neither black nor white, nor green, red, orange, or blue- it is colourless. It is purpose that adds all these elements, all these colours to the data- and we at Talespinners capture that intent and present it through our various visual mediums. The mediums we use include graphic design, motion graphics, and ‘Datamotion’.
’Datamotion’ is a term we’ve coined to define our unique approach to storytelling. It is essential to understand the importance and impact of audio-visuals on an audience. What an audience might retain from reading a static document, they are far more likely to retain when they see the same information in an audio-visual format. It only enhances the impact when the format is represented beautifully. To that end, if you leave your graphs- crafted with such meaning in your spreadsheet- with us, we’ll add the necessary colour, motion and identity to your data. In short, your data will be in motion.
the tale weaver.
raj gautam mitra.
rgmitra@talespinners.in
the tale designer.
raj rishi mitra.
rishi@talespinners.in
the services we provide.
-
Summary
Synthesize
Analysis
-
Infographic
Report
IEC materials
Brochures
Training modules
eLearning courses
Coffee table book
Website design
Mobile UI design
Logo design
Branding
-
Explainer video
GIFs (social media creatives)
2d short films
-
Explainer video
2d short films
to ebb and flow, in the vastness of all that is.
contact us.
